Day 6 · Monitoring & Alerting
You can't operate what you can't see. Observability is the practice of emitting enough signal — metrics, logs, traces — to know what a system is doing, why, and when it breaks. Today you stand up the classic open-source stack — Prometheus for metrics, Loki for logs, Grafana as the single pane of glass — and wire a real alert to Discord.
What you'll run
Two EC2 hosts, provisioned by Terraform in examples/monitoring-app: an app host that emits metrics (node-exporter) and logs (a demo logger), and an observability host running Prometheus + Loki + Grafana that watches it over the network.
Learning Objectives
- Explain observability vs monitoring, and the three signals — metrics, logs, traces — and when each helps
- Understand Prometheus (pull model, exporters, TSDB), the four metric types, and basic PromQL
- Understand Loki (label-based, not full-text) and basic LogQL, and how Alloy ships logs into it
- Use Grafana as one UI: a dashboard, log Explore, and an alert to Discord
- Lab: provision two EC2 hosts with Terraform, wire metrics + logs across the network, and fire a real Discord alert
Prerequisites
- An AWS account with credentials configured (
aws configure) and Terraform installed - An existing EC2 key pair for SSH
- Basic comfort with SSH and the terminal — the lab drives two Linux hosts by hand
- A Discord server where you can create a webhook (Server Settings → Integrations → Webhooks)
Cost
The lab runs two t3.micro EC2 instances. Remember to terraform destroy when you're done (there's a reminder at the end).
Theory · ~45 min
1. What is observability?
Monitoring tells you whether something is wrong — you pick some checks up front (is the host up? is disk over 90%?) and get alerted when one trips. Observability goes further: it's about emitting enough data — metrics, logs, and traces — that you can also answer why it's wrong, including questions you didn't think to ask in advance.
In short: monitoring watches the things you knew to watch; observability lets you investigate the things you didn't. You need both — and this course sets up the tools that give you them.
2. The three signals
Observability is usually built on three signals (the "three pillars" of telemetry), each answering a different question:
| Signal | What it is | Answers | Tool (today) |
|---|---|---|---|
| Metrics | Numbers over time (request rate, CPU %, error count) | "Is something wrong, and how much?" | Prometheus |
| Logs | Timestamped text/JSON events | "What exactly happened?" | Loki |
| Traces | One request's path across services | "Where in the chain did it break/slow?" | Tempo / Jaeger — skipped today |
The typical workflow ties them together: a metric alert tells you something's wrong → you jump to logs to see what → in a distributed system a trace shows where. We wire the first two today and view both through Grafana. Traces (Grafana Tempo + OpenTelemetry) are a topic of their own.
Tool per signal
Metrics → Prometheus · Logs → Loki (or Elasticsearch) · Traces → Tempo/Jaeger · Visualisation & alerting → Grafana sits on top of all of them. That "one UI, many stores" split is why Grafana is everywhere.
3. The stack we'll build
We run this across two hosts — one being watched, one doing the watching — so the signals actually cross the network, the way they would in real life:
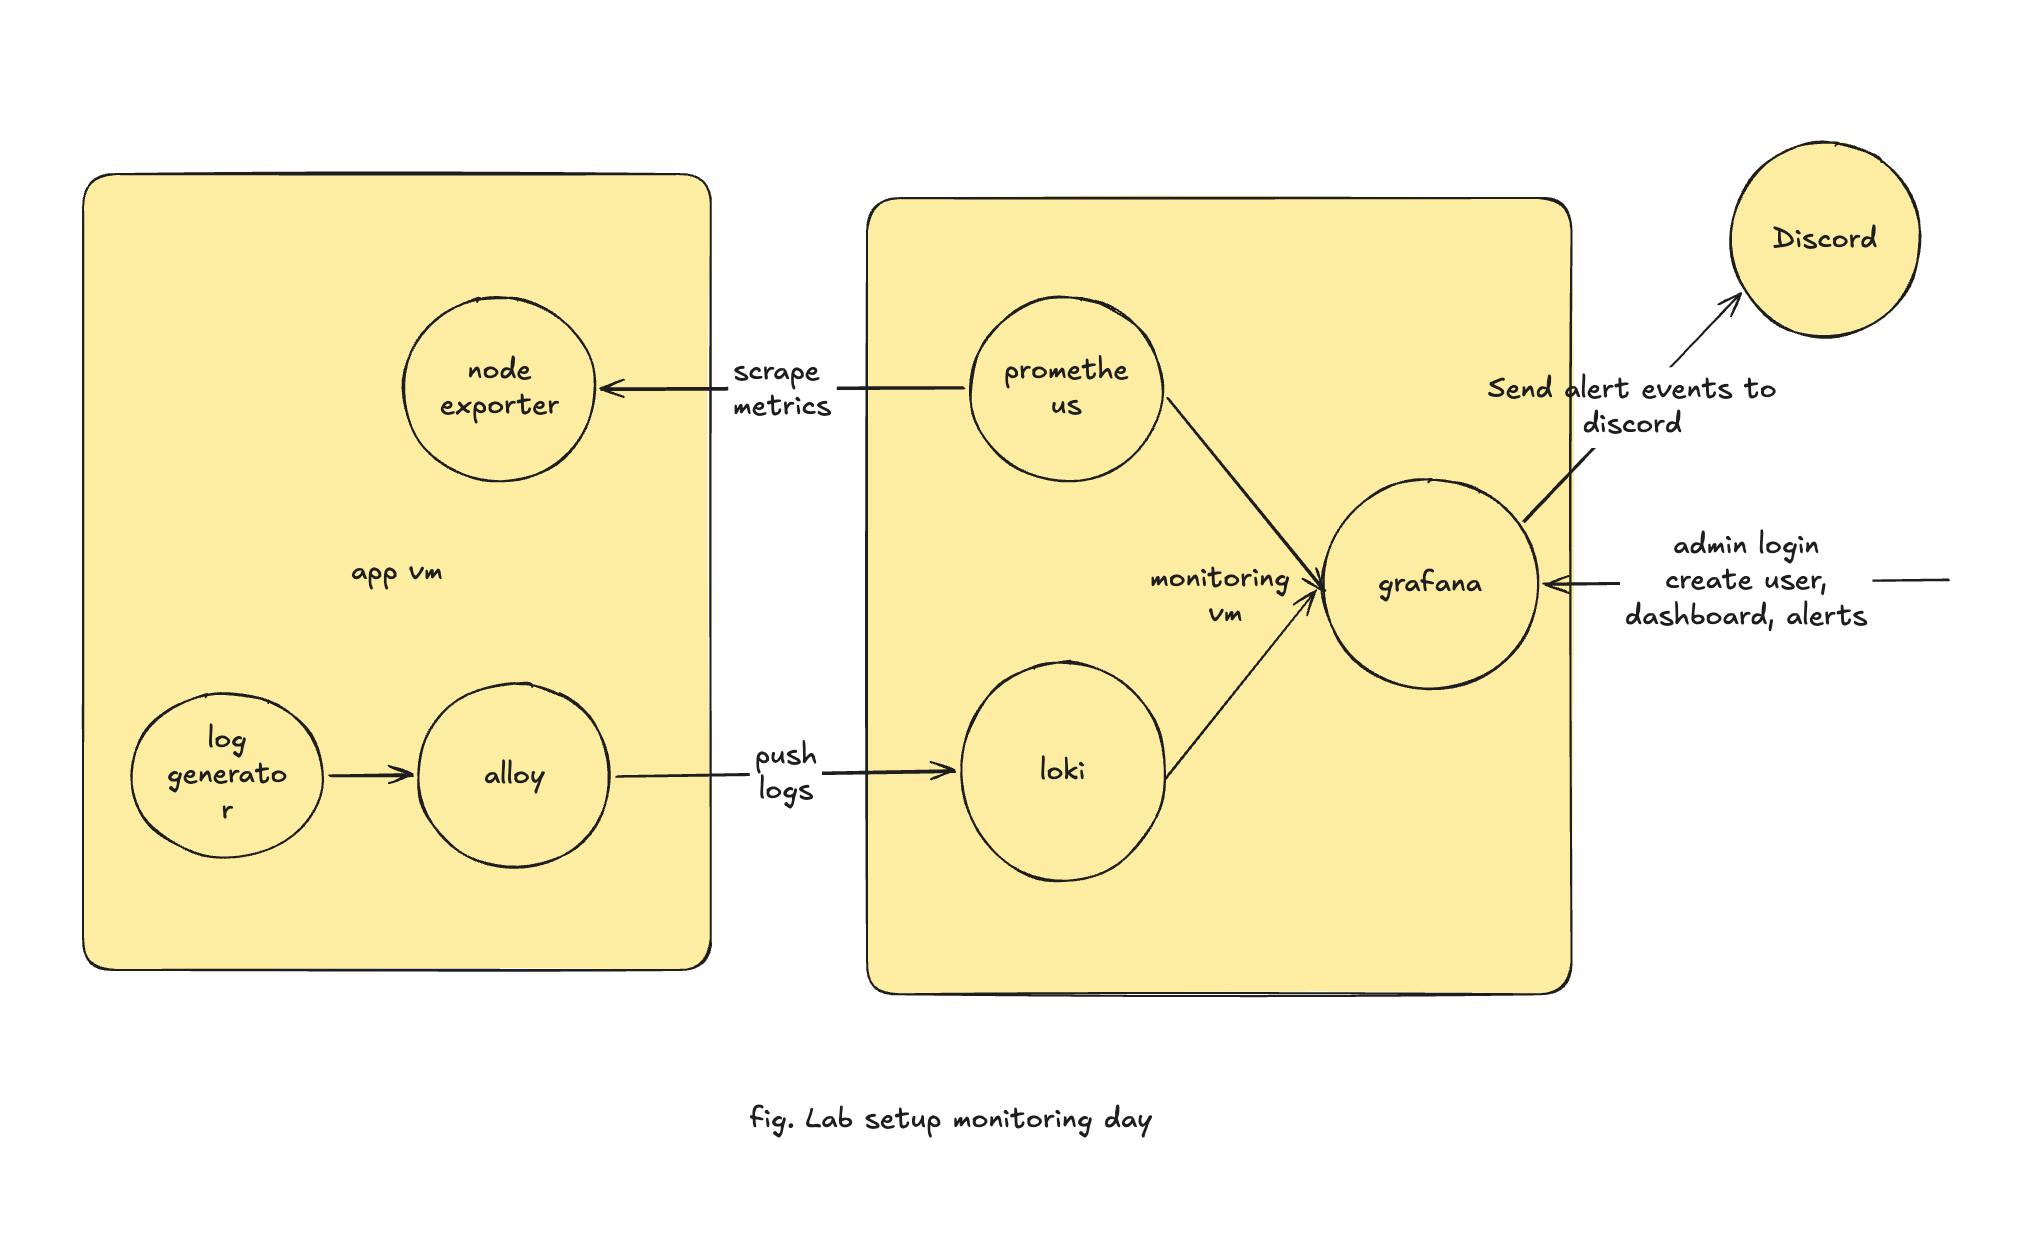
| Host | Component | Role |
|---|---|---|
| App | node-exporter | Exposes host metrics (CPU, memory, disk) as a /metrics page |
| App | random-logger | Emits random DEBUG/INFO/WARN/ERROR lines — stands in for a real app |
| App | Grafana Alloy | Log collector — tails container stdout and ships it to the remote Loki |
| Obs | Prometheus | Pulls (scrapes) /metrics from the app host every 15s and stores the numbers |
| Obs | Loki | Stores logs — "Prometheus, but for logs" (label-indexed, cheap) |
| Obs | Grafana | One UI over both stores: dashboards, log search, alerting |
We deliberately keep the moving parts few: two stores, one shipper, one UI, one alert channel.
4. Prometheus — architecture
Prometheus is a metrics database + scraper in one binary. Its defining choice is the pull model: Prometheus reaches out and scrapes an HTTP /metrics endpoint on each target, rather than targets pushing to it. That means targets are dumb (just expose a page of numbers), and Prometheus decides what/when/how often.
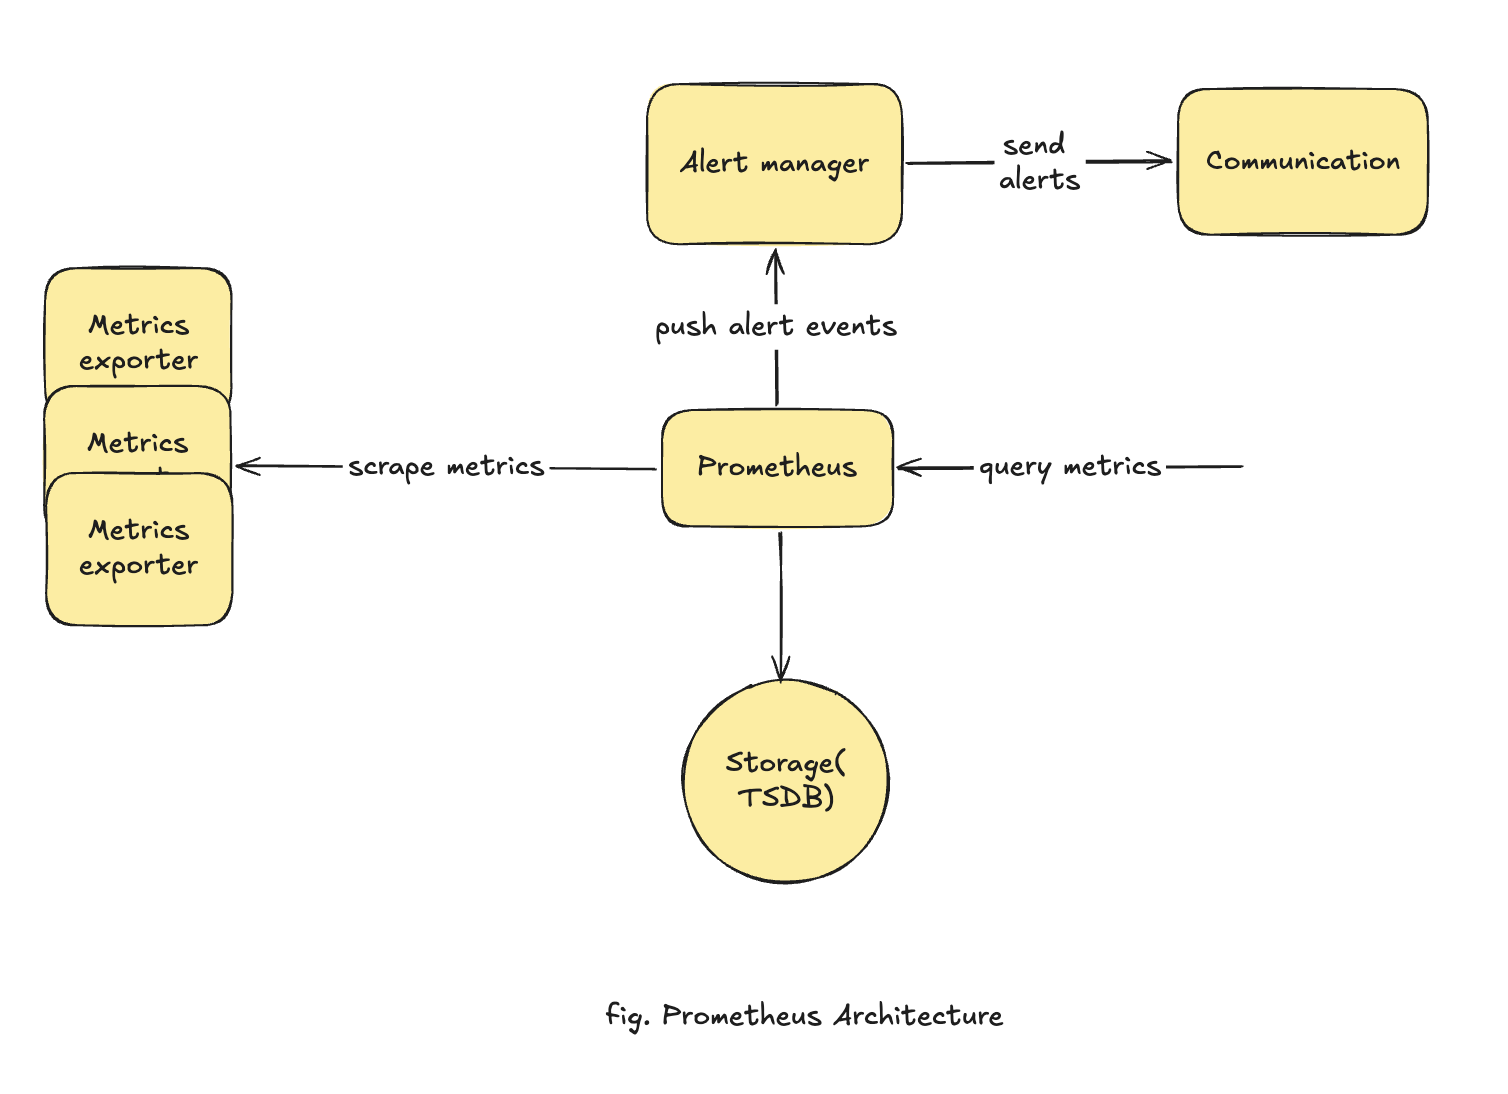
Key ideas:
- Exporters translate something that doesn't speak Prometheus into a
/metricspage —node-exporterfor a host,postgres_exporterfor a DB, etc. Apps can also expose metrics natively via a client library. - Time series = a metric name + a set of labels, e.g.
node_cpu_seconds_total{cpu="0", mode="idle"}. Each unique label combo is its own series — so keep labels low-cardinality (never put a raw user id or request id in a label). - Storage is a local TSDB; Prometheus is built to be run per-environment, not as one giant global instance.
- Alertmanager is a separate component for routing/grouping/silencing alerts. Today we let Grafana do alerting instead (one less moving part) and note Alertmanager as the Prometheus-native path.
5. Anatomy of a metric
Every metric Prometheus scrapes has the same shape — read one and it tells you a lot before you even query it:
node_cpu_seconds_total{cpu="0", mode="idle"}   12345.6
└──────── name ───────┘└──────── labels ──────┘ └ value ┘
- Name — snake_case, read left→right as
namespace_subsystem…_unit_suffix:node(the exporter) ·cpu·seconds(the unit) ·_total(it's a counter). The name alone says "cumulative CPU seconds." - Labels — key/value dimensions that split one metric into many time series (
cpu="0",mode="idle"). You filter on them ({mode="idle"}) and aggregate on them (sum by (mode)). Keep them low-cardinality. - Value — one number per scrape; stored over time, that's a time series.
Unit conventions — Prometheus uses base units (seconds, bytes — never ms/KB), and the suffix hints at how to read it:
| Suffix | Meaning | Example |
|---|---|---|
_bytes |
a size in bytes | node_memory_MemAvailable_bytes (429215744 ≈ 409 MiB) |
_seconds |
a duration in seconds | node_cpu_seconds_total |
_total |
a counter — read it with rate(), not raw |
node_network_receive_bytes_total |
| (none) | a gauge — a current value you can read directly | node_load1 |
6. The four metric types
A client library / exporter gives you four types. Know when each is used:
| Type | Goes | Use for | node-exporter example |
|---|---|---|---|
| Counter | only up (resets on restart) | totals of events | node_network_receive_bytes_total |
| Gauge | up and down | a current value | node_memory_MemAvailable_bytes |
| Histogram | buckets of observations | latency/size distributions → quantiles | prometheus_http_request_duration_seconds_bucket |
| Summary | client-side quantiles | quantiles when you can't aggregate | rare; prefer histograms |
Rule of thumb: count things → Counter; measure a level → Gauge; time/size things → Histogram. You almost never need Summary.
7. PromQL in five minutes
PromQL queries those time series. Run these in the Prometheus Graph tab, top to bottom — each one builds on the last:
# 1. Is the target up? 1 = scrape ok, 0 = failed. The simplest query there is.
up{job="node"}

# 2. Free memory — a gauge, read directly (value is in bytes)
node_memory_MemAvailable_bytes

# 3. Free disk on the root filesystem — same idea, but pick one series with a label
node_filesystem_avail_bytes{mountpoint="/"}

# 4. Network in / out — these are counters, so wrap in rate() → bytes per second
rate(node_network_receive_bytes_total[5m])
rate(node_network_transmit_bytes_total[5m])

# 5. A little math: turn free disk into "percent used"
100 * (1 - node_filesystem_avail_bytes{mountpoint="/"}
          / node_filesystem_size_bytes{mountpoint="/"})

# 6. CPU utilization % — aggregate across all cores, then invert idle
100 * (1 - avg(rate(node_cpu_seconds_total{mode="idle"}[5m])))
Two things trip people up: you almost always wrap a counter (anything ending _total) in rate(...) — the raw number only ever climbs, so its slope is what matters — and [5m] is a range that rate() needs, not a label filter.
8. Loki — architecture
Loki is a log store designed to be cheap. Its trick: unlike Elasticsearch, it does not full-text index your logs. It indexes only a small set of labels (like container="random-logger"), stores the raw log lines compressed in object storage, and does text filtering at query time by brute force over the matched streams. Fewer indexes → far cheaper to run, at the cost of slower ad-hoc text search over huge ranges.
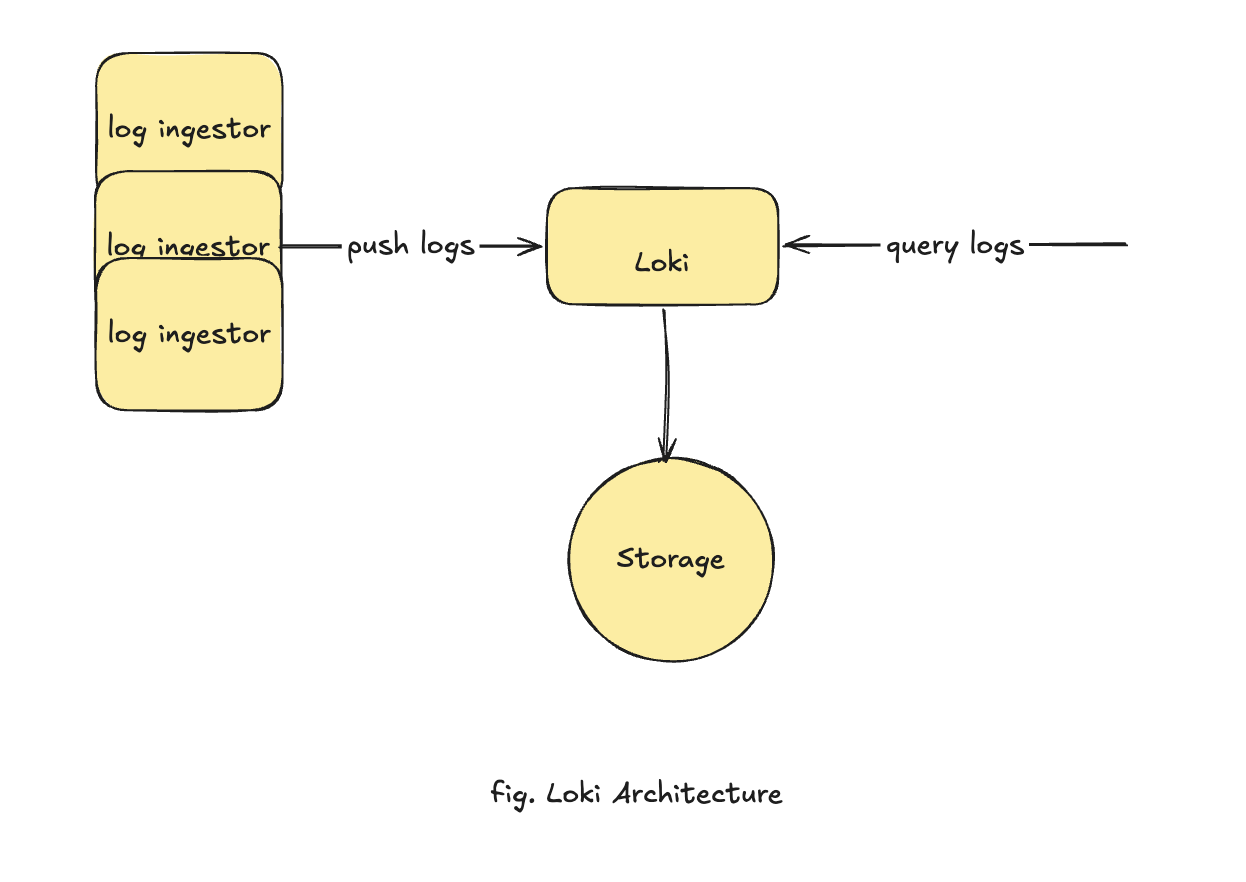
Notice the shape mirrors Prometheus: shippers push logs in (where Prometheus pulls metrics), Loki writes to storage, and you query logs back out.
A log stream = a unique set of labels. Same discipline as Prometheus: labels are low-cardinality (container, level), and everything else stays in the log line, filtered with LogQL. In production Loki splits into distributor/ingester/querier components; today we run the single-binary mode — one container, filesystem storage.
9. Alloy — the log shipper
Loki doesn't collect logs; something has to push them in. Older tutorials use Promtail — it reached end-of-life in early 2026. Its replacement is Grafana Alloy, a single collector (built on the OpenTelemetry Collector) that can carry logs, metrics, and traces. Its pipeline is a chain of components:
discovery.docker  ──▶  discovery.relabel  ──▶  loki.source.docker  ──▶  loki.write
(find containers)      (tidy the labels)       (tail their stdout)      (push to Loki)
Each block declares one component and wires its output into the next. We point it at the Docker socket so it auto-discovers every container in the stack.
10. Grafana — the single pane of glass
Grafana stores nothing — it queries data sources you register (Prometheus, Loki). From one UI you get dashboards (PromQL/LogQL panels), Explore (ad-hoc queries, great for logs), and alerting (which we set up hands-on in the lab). Metrics, logs, and alerts from one place — that's what keeps the moving parts few.
Grafana can be configured two ways: click through the UI, or provision from files (data sources, dashboards) so the setup is reproducible. We provision the data sources so they're wired the moment Grafana boots.
Lab · ~60 min
You'll provision two EC2 hosts with Terraform, then SSH in and bring the stack up by hand — Prometheus first, then Loki, then Grafana — so you watch each signal light up. Everything is in examples/monitoring-app.
1. Provision the two hosts (Terraform)
Clone the repo on your laptop and move into the Terraform project:
git clone https://github.com/rbalman/devops-month.git
cd devops-month/examples/monitoring-app/terraform
This project creates an app host and an observability host in your default VPC, opens a security group (SSH + the UIs open to the world; all traffic between the two hosts), and installs Docker + Compose on each via user_data.
Set your variable — open terraform.tfvars and fill in key_name (an existing EC2 key pair):
Then provision:
When it finishes, print the host IPs — you'll paste these in the next steps:
Wait about a minute after apply for user_data to finish installing Docker on both hosts.
2. App host — generate the signals
SSH in and fetch the files:
ssh -i <your-key.pem> ubuntu@<app_public_ip>
git clone https://github.com/rbalman/devops-month.git
cd devops-month/examples/monitoring-app/app-instance
Point Alloy at the observability host's private IP, then start the signal generators (node-exporter + random-logger + Alloy):
sed -i "s/OBS_PRIVATE_IP/<observability_private_ip>/" alloy/config.alloy
docker compose up -d
docker compose ps
Confirm metrics are exposed and logs are flowing:
curl -s localhost:9100/metrics | head        # node-exporter is serving metrics
docker compose logs --tail=5 random-logger   # random log lines
Alloy will keep retrying its push to Loki until you start Loki in step 4 — that's expected.
3. Observability host — Prometheus first
In a second terminal, SSH into the observability host and fetch the files:
ssh -i <your-key.pem> ubuntu@<observability_public_ip>
git clone https://github.com/rbalman/devops-month.git
cd devops-month/examples/monitoring-app/observability-instance
Point Prometheus at the app host's private IP, then bring up just Prometheus:
sed -i "s/APP_PRIVATE_IP/<app_private_ip>/" prometheus/prometheus.yml
docker compose up -d prometheus
Open http://<observability_public_ip>:9090 → Status → Targets — the node job should be UP. Then try some PromQL in Graph:
100 * (1 - avg(rate(node_cpu_seconds_total{mode="idle"}[5m])))   # CPU busy % on the app host
node_memory_MemAvailable_bytes                                   # free memory
Metrics, end to end, across two machines.
4. Then Loki
Loki now accepts the pushes Alloy has been retrying from the app host. Give it a few seconds.
Sanity-check that logs are actually arriving — without Grafana — by hitting Loki's HTTP API directly on the observability host:
# Loki is up and ready
curl -s localhost:3100/ready

# Which container log streams have arrived? Expect "random-logger", "alloy", …
curl -s localhost:3100/loki/api/v1/label/container/values

# Pull a few recent lines from the app's logger
curl -sG localhost:3100/loki/api/v1/query_range \
  --data-urlencode 'query={container="random-logger"}' \
  --data-urlencode 'limit=5'
If the label values are empty, Alloy isn't reaching Loki yet — recheck OBS_PRIVATE_IP in alloy/config.alloy on the app host. (Add | jq for readable JSON; sudo apt-get install -y jq if needed.)
5. Then Grafana
Open http://<observability_public_ip>:3000 and log in with admin / admin.
Now add the two data sources by hand. Go to Connections → Data sources → Add data source, and add each of these:
-
Prometheus
Set URL to
http://prometheus:9090, then click Save & test. -
Loki
Set URL to
http://loki:3100, then click Save & test.
Grafana reaches them by service name because all three share the Compose network on this host.
6. A dashboard
Dashboards → New → Import, ID 1860 (Node Exporter Full), pick Prometheus. Instant CPU/mem/disk/network for the app host, live.
7. Query logs in Explore
Explore (compass icon) → Loki → run:
{container="random-logger"}                 # all app-host logs, streaming
{container="random-logger"} |= "ERROR"      # just the error lines
Logs from the other machine, in the same UI as its metrics.
8. Alert to Discord
Alerting in Grafana is two pieces: a contact point (where a notification goes — here, a Discord webhook) and an alert rule (a query + condition that fires once it stays true for a set duration). No separate Alertmanager to run.
Create a Discord webhook (Server Settings → Integrations → Webhooks), add it as a Discord contact point in Grafana, then write a rule against something that actually matters — for example:
- A host is down —
up{job="node"} == 0 - Disk filling up — free space on the app host drops below, say, 15%
- Errors spiking — more than 5
ERRORlines in the last few minutes (a LogQL rule over Loki)
Give the rule a for duration (e.g. 1m) so it fires only when the condition persists, point it at your Discord contact point, and save. Trigger one — e.g. docker compose stop node-exporter on the app host — and watch it go Pending → Firing in Discord, then resolved when you bring it back.
You closed the loop
Metrics and logs from one host, monitored from another, unified in Grafana with a real alert to Discord — your system now tells you when something's wrong. That's production-grade observability from open-source parts.
Tear down when done
Two EC2 instances bill by the hour. From your laptop: cd examples/monitoring-app/terraform && terraform destroy.
Advanced Topics
- Instrument your own app — expose a
/metricsendpoint with a client library and scrape it; add cAdvisor for per-container metrics → Prometheus client libraries · cAdvisor - Alertmanager — the Prometheus-native way to route/group/silence alerts if you outgrow Grafana alerting → Alertmanager docs
- Recording rules & SLOs — pre-compute expensive queries; alert on user-facing objectives, not raw CPU → Prometheus recording rules · Google SRE — SLOs
- Dashboards & alerts as code — provision dashboards and alert rules from files like we did data sources → Grafana provisioning
- Traces — the third signal — Grafana Tempo + OpenTelemetry, correlated with metrics & logs → Tempo docs
Assignment
Watch all the videos in the Prometheus architecture playlist linked from the theory section above. Take notes on how the pull model, exporters, TSDB, and Alertmanager fit together — you'll build on this understanding in the labs.
Further Reading
The intro videos for each tool are embedded in the theory sections above. Official docs for going deeper:
- Prometheus: Getting started · Metric types · PromQL basics · node_exporter
- Grafana: Fundamentals · Data sources · Alerting · Discord contact point
- Loki & Alloy: Loki docs · LogQL · Alloy docs